

Traders,
Advanced charting without any cost for data is one of the big pluses of Pi. We have 10 chart types with over 80 indicators. Over the last few months, our clients testing Pi have requested for a lot more indicators. We will start adding them soon. This post will talk about all the basics of using charts on Pi.
If you want to learn more about Technical Analysis, get onto Zerodha Varsity.
Invoking a Chart
There are three easy ways to invoke a chart.
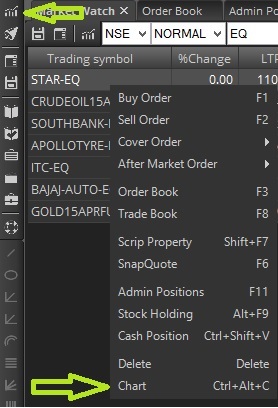
- Right click on the scrip on your marketwatch, and choose Chart
- Use the shortcut key Shift+C
- Use Create new chart icon
Invoking the chart
Selecting a time frame
You can currently open minute, hour, and day charts. Intraday charts are available for up to 6 months, and day charts for over 5 years (top 150 stocks and indices). We will add more data and stocks to this soon. F&O charts are available only for as long as that contract has been live. We suggest looking at the underlying stock/indices charts for much longer historical analysis. And yes, we also have options charts from when the contract has started trading.
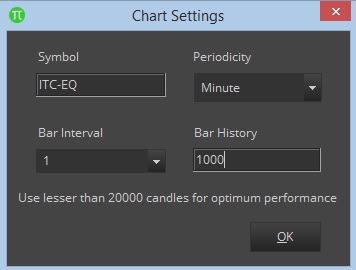
Once you invoke the chart, you can use this box for selecting the time frame. You can open upto 50,000 candles based on your system speed and configuration, but we suggest using lesser than 20,000 especially when trading. If you request for more bar history than what is available it will display the chart from when the data is available.
Select time frame
If you want a 1-minute chart, use like the image above. If you want a 5-minute chart, change the bar interval to 5 but keep the periodicity as minute. If you want a 1-hour chart, change periodicity to hour and bar interval to 1. Similarly for Day chart, change periodicity to day and interval to 1. If you want a day chart for the last 1000 days (bars), keep the bar history as 1000. If you want the last 10,000 1-minute candles, keep the bar history as 10,000.
Note: If you want to change the time frame for a particular chart, you can’t do this directly, you have to follow the same process as described above. With Pi, you can invoke charts of multiple time frames at the same time unlike other platforms where you can have only 1 chart per contract.
The chart might take some time to load if you are requesting for larger bar history.Check this video on loading charts of different time frames.
Chart types & Indicators
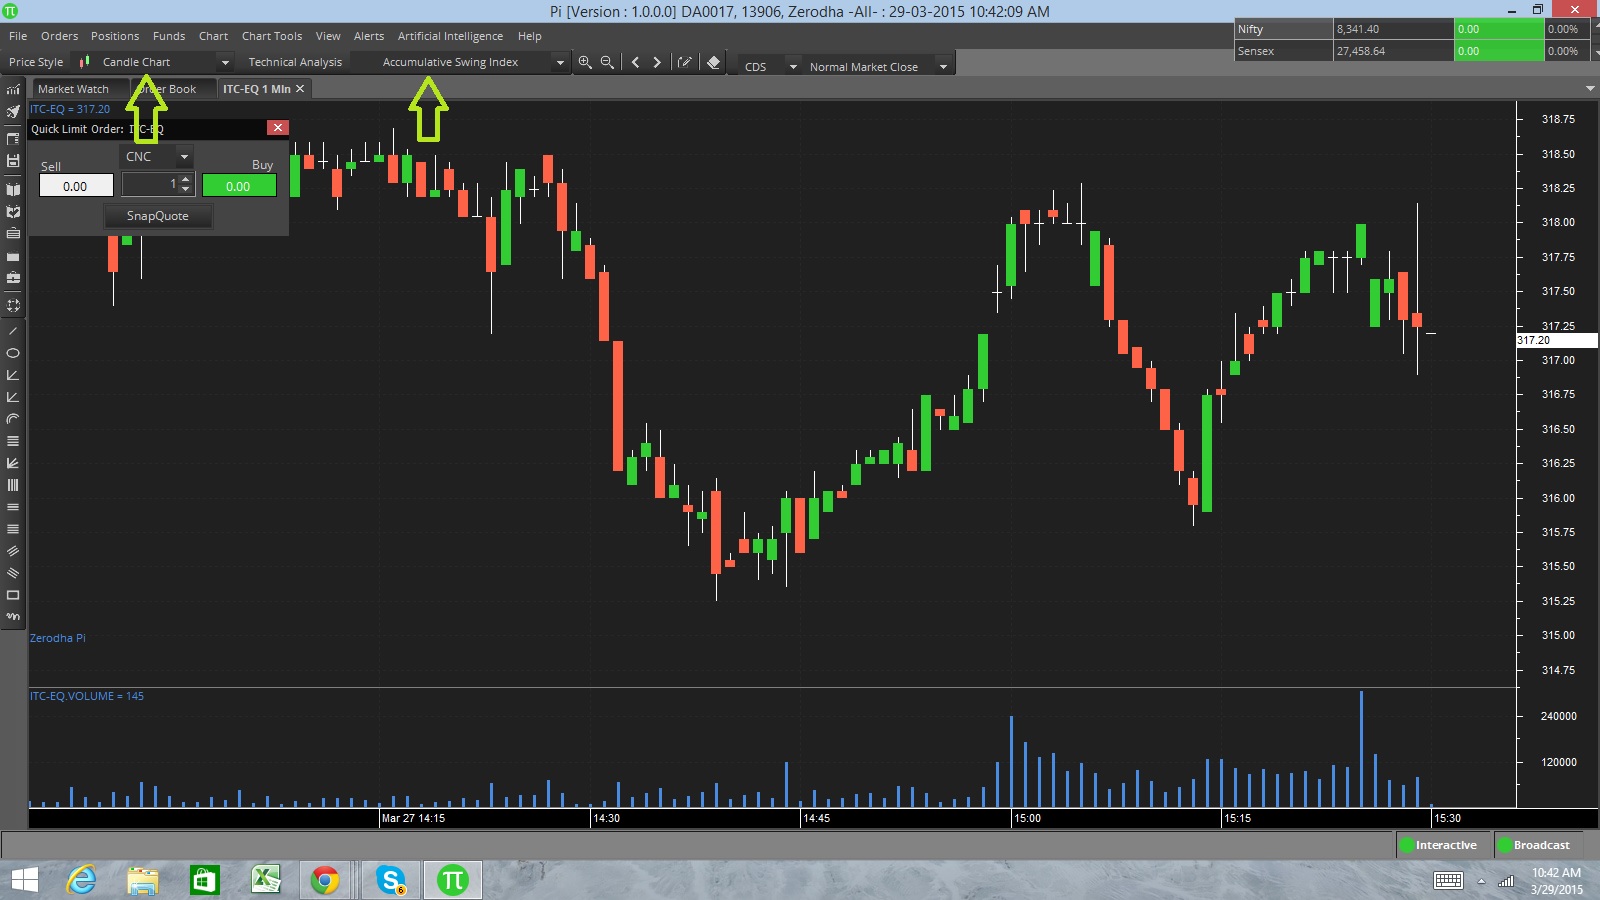
We have 10 chart types and over 80 indicators. The default chart type is candlesticks, and you can use the price style and technical analysis dropdown for selecting chart type and indicator respectively. Note that these two dropdowns get enabled only if you have a chart open.
Selecting Chart types and indicators
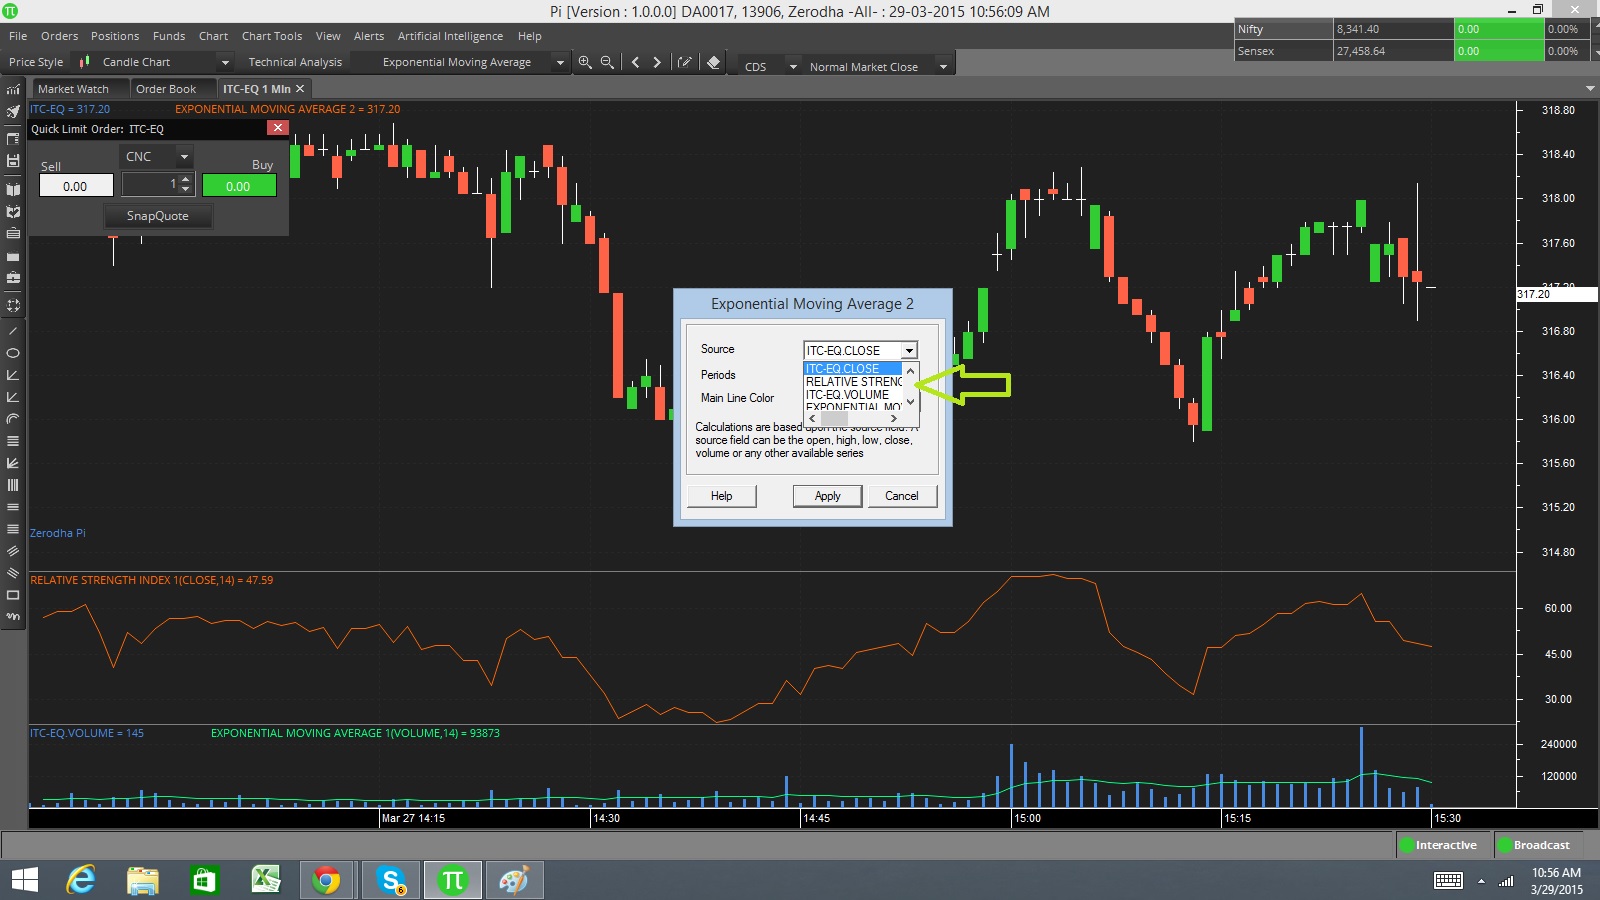
You can add an indicator on Open, High, Low, Close, Volume, or another indicator as shown below. (In the pic below, we have added an EMA on volume, and now trying to add EMA on RSI). Check this video.
Adding indicator on O,H,L,C, Vol, and another indicator
When you are trying to add an indicator on an indicator, it is possible that it gets added to the main price panel, instead of the panel in which the indicator is. If this happens, click on the indicator, you see white square boxes. Left click on the white box and drag it to the panel you want it on.
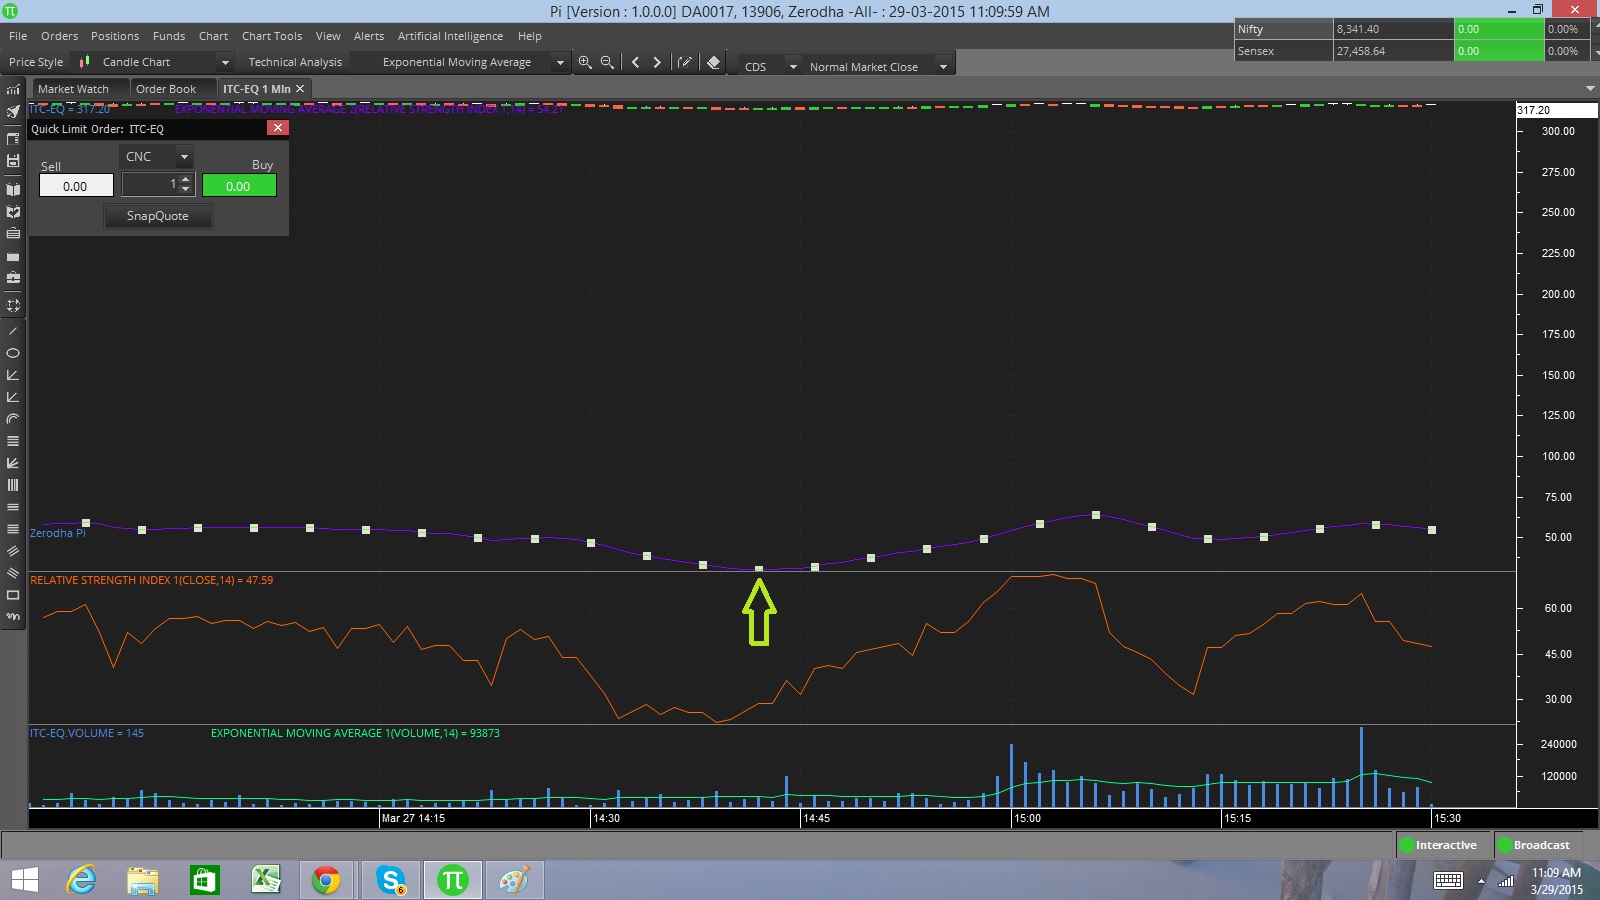
Dragging the indicator on correct panel.
Deleting an Indicator
In the pic above, once you have clicked on the indicator press the delete button to remove the indicator.
Viewing OHLC and Volume of a Candle
To check the OHLC and Volume (tooltip) of a candle, left click anywhere on the chart and hover your mouse over the candle keeping your mouse clicked as shown below. You can also check this video.
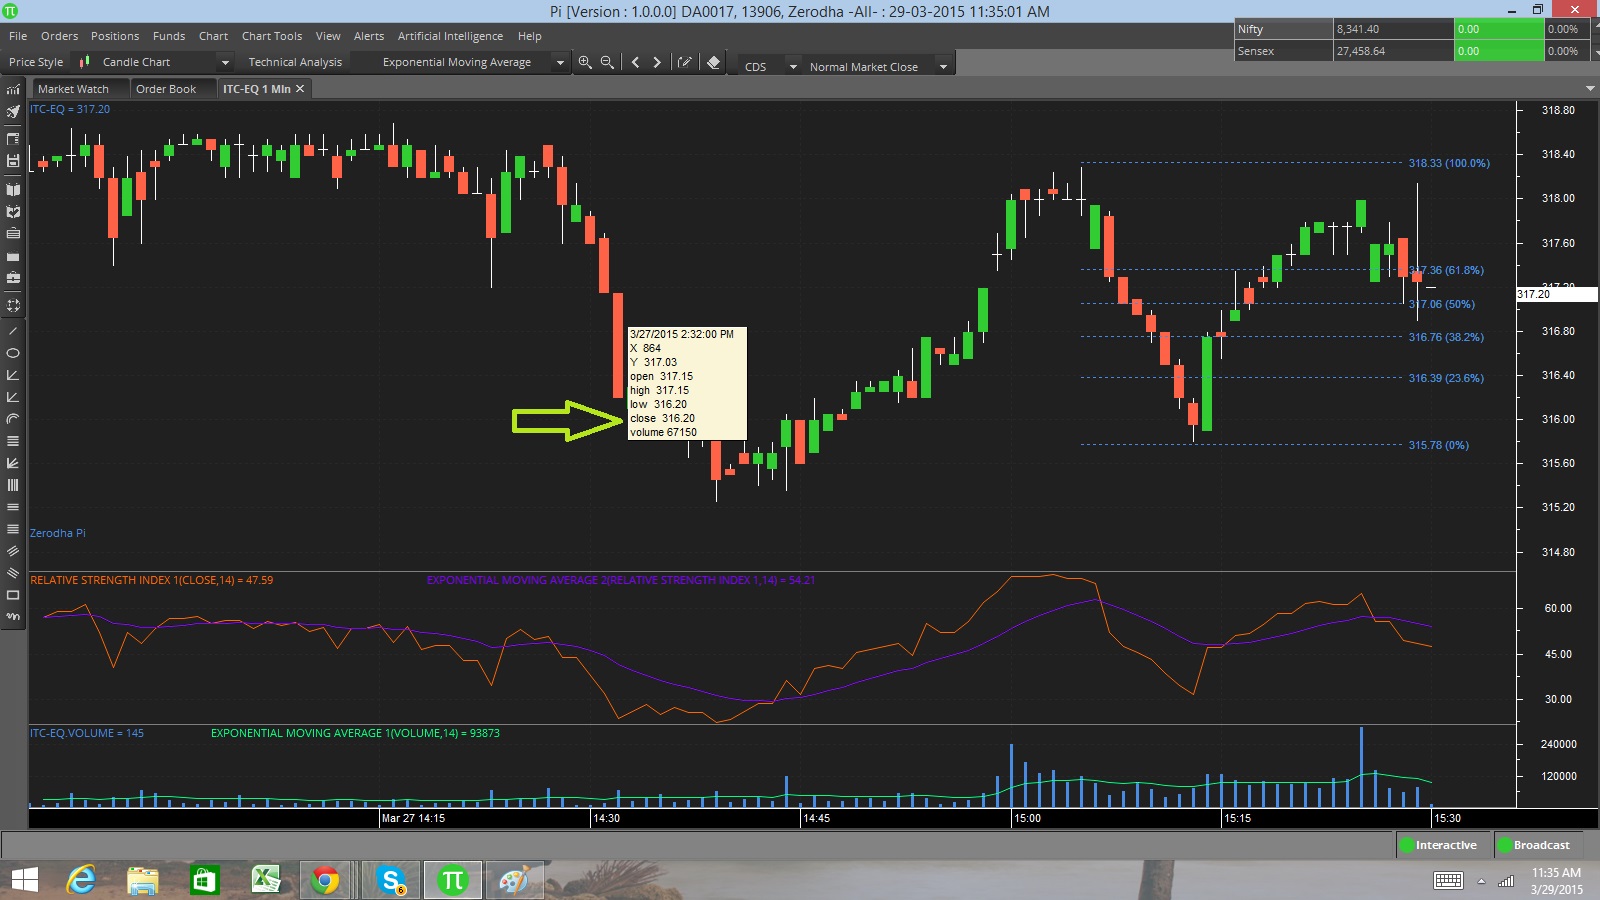
Watching O,H,L,C, and Volume
Drawing tools
We currently have over 14 drawing tools, from trend lines to Fibonacci retracement. We will keep adding more. To use any of the drawing tools all you need to do is select it from the left panel as shown below and then draw based on where you want it.
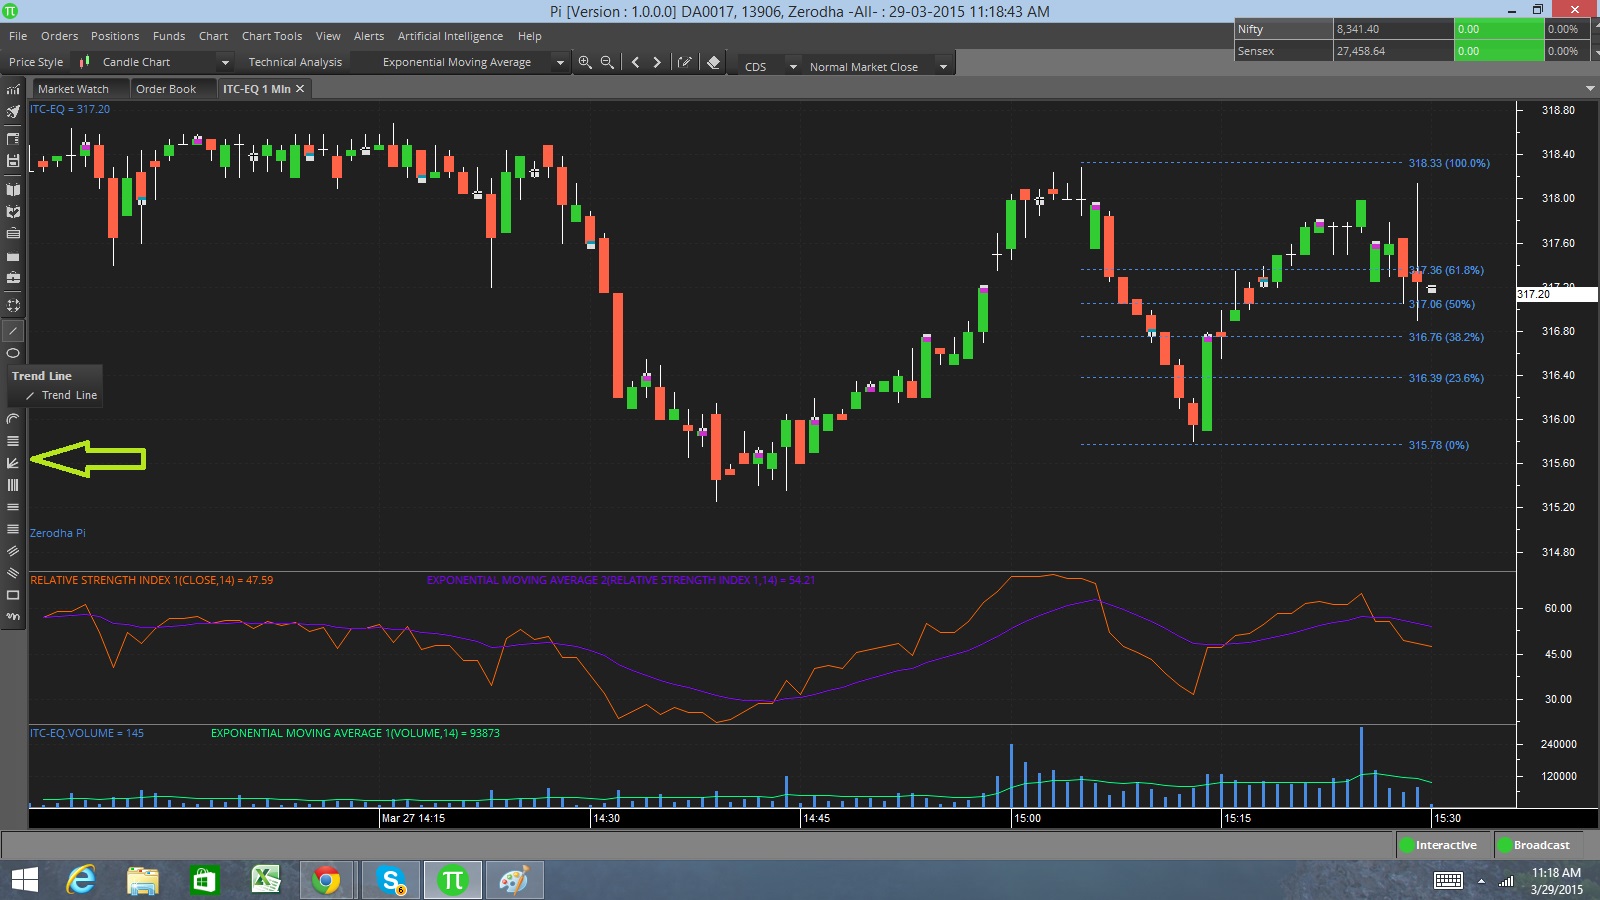
Over 14 drawing tools
Zoom in and Zoom out
Pi has shortcut keys for almost everything, but for regular everyday actions we’ve tried to make it even more simpler. You can use the up/down arrow keys to zoom in and zoom out. You also have the zoom in/zoom out buttons on top of the chart. You can even right click on the chart and decide to “Complete Zoom Out” or “Zoom Selected Area”. Check out this video to see how it’s done.
Scroll Left and Right
Scrolling through a chart is possible by using the right and left arrows on your keyboard. Alternatively, you can scroll using your mouse. Ideally, it’s best to use the up/down/right/left keys in coordination to arrive at the right point on your chart. If the point you’re scrolling to is very far, just right click and zoom out completely and then choose the portion of the chart you’d like to view and zoom in there.
Right click menu on the chart
Right clicking on your chart opens up a lot of additional options as shown in the image below.
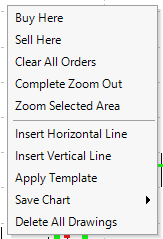
Right click on chart
Buy Here: You can buy directly from the chart. Yes, this is possible. View your chart in detail and decide exactly where your buy should happen.
Sell Here: You can sell directly from the chart without having to open an order form.
Clear All Orders: You can clear/cancel any open orders on the chart by choosing this option.
Complete Zoom Out: Use this option if you want to see all the available data on the chart.
Zoom Selected Area: Choose this option and click any two points on the chart and that portion gets zoomed in.
Insert Horizontal Line: Use this option if you want to draw a horizontal line to get your Support/Resistance lines.
Insert Vertical Line: Use this option to draw vertical lines on your chart.
Save Chart: You can save your chart as an image or even a template with all your indicators for future use.
Delete All Drawings: Delete all your drawings at once instead of clicking on each drawing and hitting the delete button.
Invoking an Index chart
First add the index on the marketwatch as shown below, and then follow the same steps like you would for any other scrip. You can open index charts for Nifty, Banknifty, CNXIT, among others.
No comments:
Post a Comment